2018年8月18日雅思大作文机经预测:话题7
来源 :中华考试网 2018-08-10
中2018年8月18日雅思大作文机经预测:话题7
参考题目7
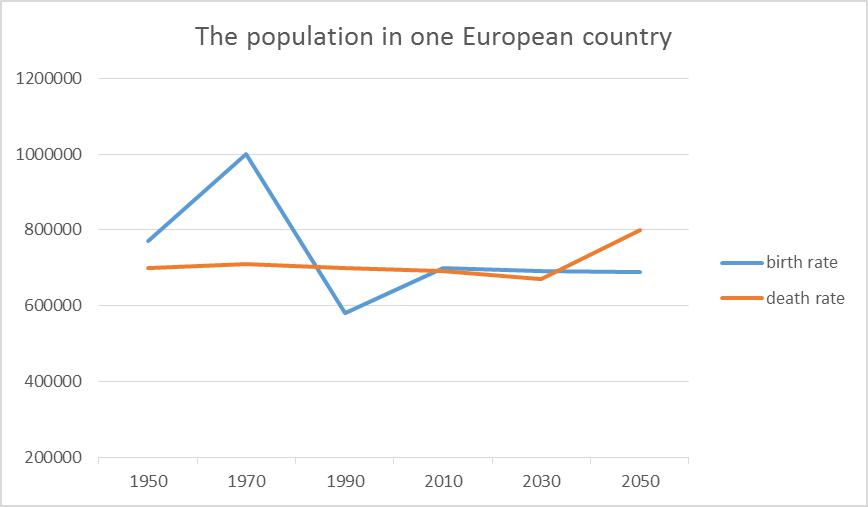
The line graph shows the population in one European country.
图片
解题思路
【首段】总述图表显示某个欧洲国家从1950到2050出生率和死亡率的变化情况 【二段】分述这段时期这个国家的出生率的变化情况 【尾段】分述这段时期这个国家的死亡率变的化情况
范文
The line graph reveals both the birth rate and death rate in a European country during the year of 1950 to 2050. In 1950, the total number of people in this country was approximately 780,000, and after that it soared to nearly 1,000,000. However, after the peak in 1970, the number of population experienced a decline from 1971 to 1990 and it dropped to about 580,000. After then, it increased again in the following two decades, at around 700,000 in 2010. The birth rate is expected to be stable at 700,000 before 2050. Compared with the birth rate, the figure of the death rate was much more stable. During the year of 1950 to 2010, the death rate remained at around 700,000. However, it seems that there will be a continuous rise in the number of the death population in the near future, reaching 800,000 by the year of 2050.