2018年8月18日雅思大作文机经预测:话题6
来源 :中华考试网 2018-08-10
中2018年8月18日雅思大作文机经预测:话题6
参考题目6
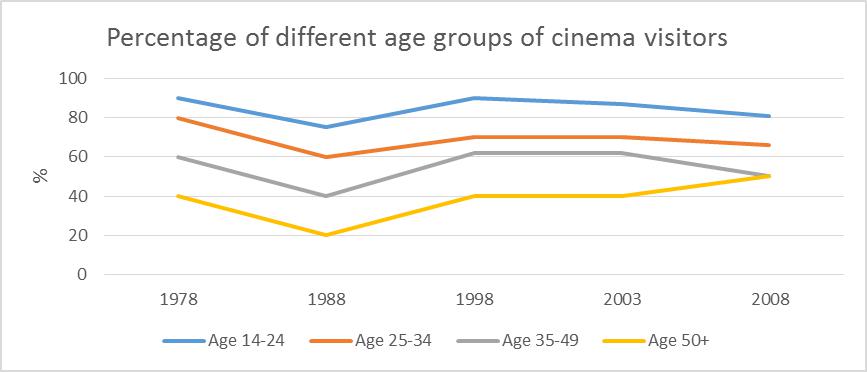
The line graph shows the percentage of different age groups of cinema visitors in a particular country.
图片

解题思路
【首段】总述图表显示某个国家的四个年龄阶层从1978到2008年到影院看电影的比例变化 【二段】分述14-24,25-34以及35-49这三个年龄阶层到影院看电影的比例变化 【尾段】分述50岁以上老年人到影院看电影的比例变化
范文
The line graph reveals the proportion of people who go to the movies by four age groups in a particular nation from 1978 to 2008. During the thirty years, three age groups (14-24, 25-34 and 35-49) experienced a similar pattern. The young (age 14-24) enjoyed visiting cinema the most, reaching 90% in 1978, and then it declined slightly to 75% in 1988 and grew up again in the following ten year. Before a drop in 2003, it had remained stable for five years. Likewise, to the percentage of cinema visitor aged from 25 to 34, there is a significant decrease from 80% to 60% between 1978 and 1988, followed by a moderate increase in 1998. After that, it was stable during 1998 and 2003 and then fell to 56% in 2008. Similarly, the share of age group 35-49 arrived at the bottom at 40% before a considerable rise in 1988. A decade later, it reached the peak at about 62% and kept constantly until a fall from 2003. The proportion of elder movie visitors was always below 40% from 1978 to 2003. However, after the year of 2003, more elderly people preferred to watch movies at cinema and the figure increased to 50% in 2008.
